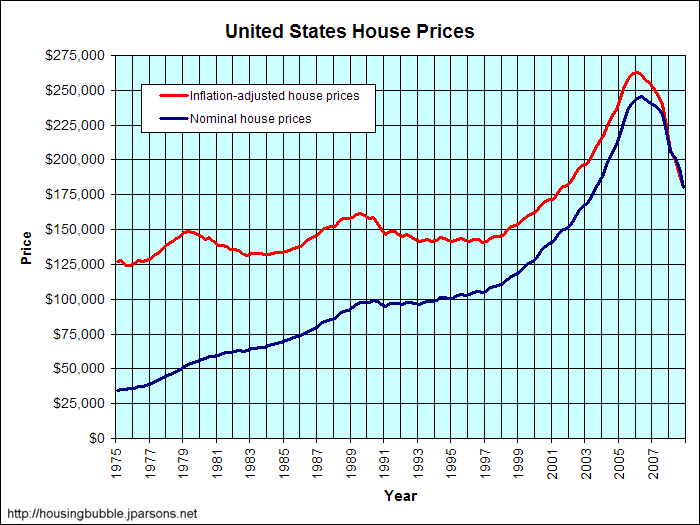
I ran into this graph from
this article which I particularly like because it shows two things clearly: Inflation adjusted home prices usually stay in the range between 125k-16k; and housing bubbles have happened before but the post-bubble prices approximately equal the pre-bubble prices. So, when we hit a median house price around 140k it is time to be calling the bottom. We have been doing so much building that it may drop below this number for a while but don't expect prices to stop falling before then. I had previously predicted that home prices would fall to 2000 levels. Looking at this graph that shouldn't be too far from correct, 1997 prices look closer to long term trends but if income has risen at all than 2000 prices are probably sustainable.
There is a lot of talk in washington about stopping this decline in home prices. It won't happen no matter how much money people throw at the problem. People simply cannot afford houses unless they drop to this price range. Until then, rent.


No comments:
Post a Comment