
The whole project would have been way easier in Excel, but it seemed a good way to learn plotting and mathematics in Python.
First I plotted my weight and number of steps:


So I tried plotting steps versus weight for the days where I have both sets of data. The X axis is how many steps I took that day, and the Y axis is what I weighed that morning:

Some of the noise can be removed by instead plotting monthly averages. For every 30 day period in the dataset I averaged my steps and averaged by weight:
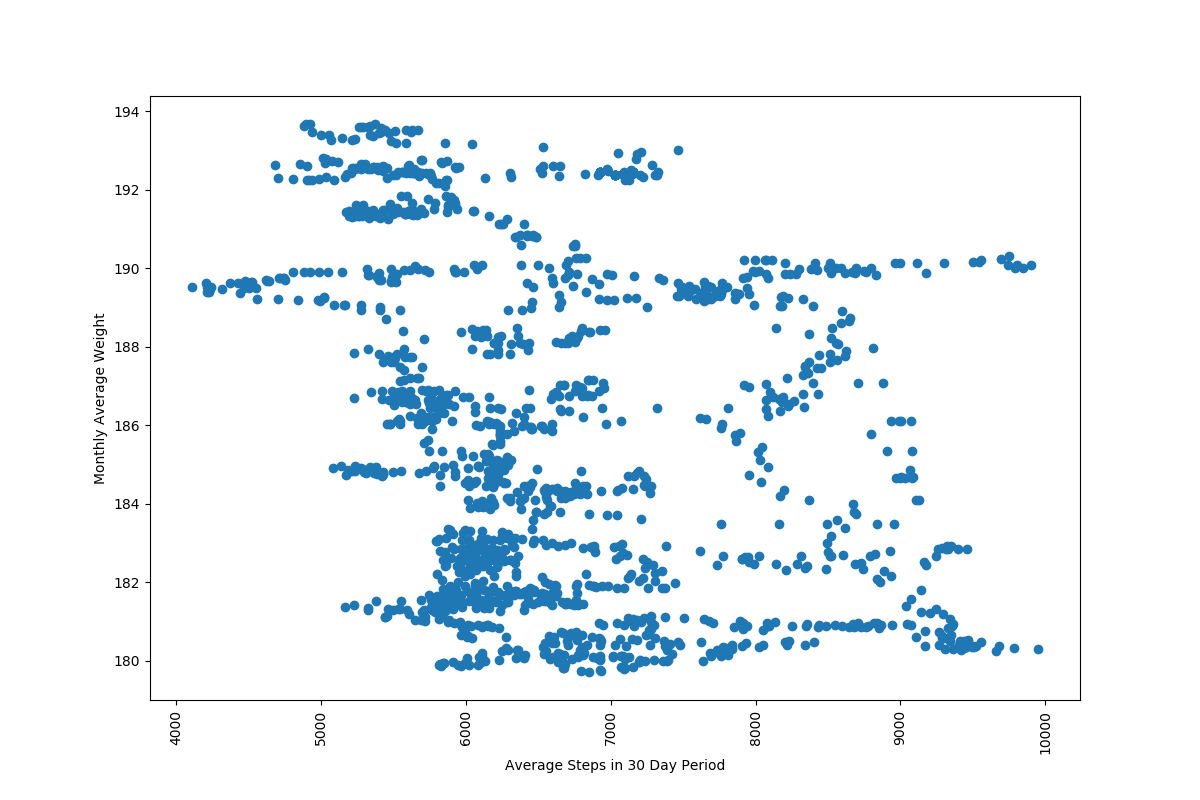
That seemed like it missed an important detail though, am I 190 pounds and dropping fast because I walk so much? or am I 180 pounds and gaining weight fast? That problem can be removed by instead looking at weight gain. So I averaged my number of steps for a 30 day period, then compared my weight in that 30 day period to my weight in the previous 30 day period:

The code to do this simple analysis started with trying to get the data out of the export.xml file which apple provides. This was easy enough in excel, but I made it a point to use python. Eventually I came up with the following script which pulls all the weight and steps from the file:
import xml.etree.ElementTreeI could have just used the data directly, but I chose to divide this up into three scripts. Now that I have all the data in a csv file it is necessary to do some basic analysis on it to make the plots. The averaging and summing necessary was done in a second script which imports the data from the previous script and again saves to csv:
# This file location will need to be edited to match where the file is.
xDoc = xml.etree.ElementTree.parse(
'E:/My Documents/Python files/export/apple_health_data/export.xml')
items = list(xDoc.getroot()) # Convert the XML items to a list
step_data = []
# Searches for steps in the XML file.
item_type_identifier='HKQuantityTypeIdentifierStepCount' # Desired data type
for i,item in enumerate(items):
if 'type' in item.attrib and item.attrib['type'] == item_type_identifier:
# Attributes to extract from the current item
step_data.append((item.attrib['type'],
item.attrib['endDate'],
item.attrib['value']))
weight_data = []
# Searches for weights in the XML file
item_type_identifier='HKQuantityTypeIdentifierBodyMass'
for i,item in enumerate(items):
if 'type' in item.attrib and item.attrib['type'] == item_type_identifier:
# Attributes to extract from the current item
weight_data.append((item.attrib['type'],
item.attrib['endDate'],
item.attrib['value']))
file_location = \
'E:/My Documents/Python files/export/apple_health_data/Extract.csv'
file = open(file_location, 'w')
# Writes the list to a csv file by putting a , after every line and a \n at the
# end of a row.
i= 0
for i in range(len(step_data)):
file.write(str(step_data[i][0])+',')
file.write(str(step_data[i][1])+',')
file.write(str(step_data[i][2])+',')
file.write(str('\n'))
i = i + 1
i= 0
for i in range(len(weight_data)):
file.write(str(weight_data[i][0])+',')
file.write(str(weight_data[i][1])+',')
file.write(str(weight_data[i][2])+',')
file.write(str('\n'))
i = i + 1
file.close()
import csvFinally I had to make a bunch of plots out of the data which was stored to the csv. This was done in a third script which imported the formatted data from the second script.
import pandas as pd
import datetime
file_location = \
'E:/My Documents/Python files/export/apple_health_data/Extract.csv'
weights = []
weight = []
# This pulls the weights data out of the csv file and puts it into the object
# called weights
with open(file_location) as csvfile:
readCSV = csv.reader(csvfile, delimiter=',')
for row in readCSV:
if row[0] == 'HKQuantityTypeIdentifierBodyMass':
pounds = float(row[2])
date_string = row[1].split()[0]
year_int = int(date_string.split('-')[0])
month_int = int(date_string.split('-')[1])
day_int = int(date_string.split('-')[2])
date = datetime.date(year_int, month_int, day_int)
weight = [date, pounds]
weights.append(weight)
step_counts = []
step_count = []
# This pulls the steps data out of the csv file and puts it into the object
# called step_counts
with open(file_location) as csvfile:
readCSV = csv.reader(csvfile, delimiter=',')
for row in readCSV:
if row[0] == 'HKQuantityTypeIdentifierStepCount':
steps = int(row[2])
date_string = row[1].split()[0]
year_int = int(date_string.split('-')[0])
month_int = int(date_string.split('-')[1])
day_int = int(date_string.split('-')[2])
date = datetime.date(year_int, month_int, day_int)
step_count = [date, steps]
step_counts.append(step_count)
# The steps from Apple come in smaller batches than make sense for this analysis
# Therefore I added up all the steps on any particular day and put it in the
# object daily_steps
summed_steps = []
daily_steps = 0
for entry in step_counts:
if entry[0] == date:
daily_steps += int(entry[1])
else:
days_steps = [date, daily_steps]
summed_steps.append(days_steps)
date = entry[0]
daily_steps = int(entry[1])
# The weights and steps were moved from a list to a dataframe for ease of some
# of the later anaylsis
weights_data_frame=pd.DataFrame(weights,columns=['date', 'weight'])
steps_data_frame = pd.DataFrame(summed_steps,columns=['date','steps'])
# The weights and steps were combined into one dataframe.
combined_data = steps_data_frame.merge(weights_data_frame, how='outer')
# In case any data is out of order it is sorted
combined_data = combined_data.sort_values(by=['date'])
# Calculates the 7 day average weight.
weekly_average_weight = combined_data["weight"].rolling(min_periods=1,
center=True,
window=7).mean()
weekly_average_weight = weekly_average_weight.to_frame('weekly average weight')
combined_data = combined_data.join(weekly_average_weight)
# Calculates the 7 day average steps.
weekly_average_steps = combined_data["steps"].rolling(min_periods=1,
center=True,
window=7).mean()
weekly_average_steps = weekly_average_steps.to_frame('weekly average steps')
combined_data = combined_data.join(weekly_average_steps)
# Calculates the 30 day average weight.
monthly_average_weight = combined_data["weight"].rolling(min_periods=1,
center=True,
window=30).mean()
monthly_average_weight = monthly_average_weight.to_frame(
'monthly average weight')
combined_data = combined_data.join(monthly_average_weight)
# Calculates the 30 day average steps.
monthly_average_steps = combined_data["steps"].rolling(min_periods=1,
center=True,
window=30).mean()
monthly_average_steps = monthly_average_steps.to_frame('monthly average steps')
combined_data = combined_data.join(monthly_average_steps)
# Compares the average weight to the average weight the week before to look
#for a gain.
i = 0
weekly_gain = []
for i in range(len(combined_data)-4):
if combined_data.iloc[i+4][3] and combined_data.iloc[i-3][3] \
and i +4< len(combined_data) and i-4>=0:
gain = combined_data.iloc[i+4][3] - combined_data.iloc[i-3][3]
dated_gain = [combined_data.iloc[i][0], gain]
weekly_gain.append(dated_gain)
i += 1
# Puts the gain into a dataframe
weekly_gain = pd.DataFrame(weekly_gain,columns=['date','weekly weight gain'])
# Merges the dataframe
combined_data = combined_data.merge(weekly_gain, how='outer')
# Compares the average weight to the average weight the month before to look
# for a gain.
i = 0
monthly_gain = []
for i in range(len(combined_data)-30):
if combined_data.iloc[i+30][5] and combined_data.iloc[i-30][5] \
and i +15< len(combined_data) and i-30>=0:
gain = combined_data.iloc[i][5] - combined_data.iloc[i-30][5]
print(combined_data.iloc[i])
date_1 = combined_data.iloc[i][0]
dated_gain = [date_1, gain]
print(dated_gain)
monthly_gain.append(dated_gain)
i += 1
# Puts the gain into a dataframe
monthly_gain = pd.DataFrame(monthly_gain,columns=['date','monthly weight gain'])
print(monthly_gain)
# Merges the dataframe
combined_data = combined_data.merge(monthly_gain, how='outer')
print(combined_data)
combined_data.to_csv("output.csv")
import matplotlib
import matplotlib.pyplot as plt
import pandas as pd
# Imports the csv, will need to change file path to match the location.
file_path = 'E:/My Documents/Python files/export/apple_health_data/output.csv'
# Puts the imported data into a dataframe
combined_data = pd.read_csv(file_path, index_col=0)
combined_data['date'] = pd.to_datetime(combined_data['date'])
# Start of a plot of date versus monthly average steps, first line defines
# which values are plotted against each other.
plt.plot_date(combined_data['date'], combined_data['monthly average steps'])
# Rotates the labels since dates get long otherwise.
plt.setp(plt.gca().xaxis.get_majorticklabels(),rotation=90,)
# Labels the y axis, x axis not named since dates seem obvious.
plt.ylabel('Average Steps in 30 Day Period')
# The plot is made larger then saved.
fig = matplotlib.pyplot.gcf()
fig.set_size_inches(12, 8)
fig.savefig('monthly_average_steps.png', dpi=100)
# Marks the end of one plot.
plt.figure()
# Start of second plot.
plt.plot_date(combined_data['date'], combined_data['monthly average weight'])
plt.setp(plt.gca().xaxis.get_majorticklabels(),rotation=90,)
plt.ylabel('Average Weight in 30 Day Period')
fig = matplotlib.pyplot.gcf()
fig.set_size_inches(12, 8)
fig.savefig('monthly_average_weight.png', dpi=100)
plt.figure()
# Start of third plot, this one is a bit different since it is a scatterplot
# rather than a date plot.
plt.scatter(combined_data['monthly average steps'], combined_data['weight'])
plt.setp(plt.gca().xaxis.get_majorticklabels(),rotation=90,)
plt.xlabel('Average Steps in 30 Day Period')
plt.ylabel('weight')
fig = matplotlib.pyplot.gcf()
fig.set_size_inches(12, 8)
fig.savefig('monthly_average_steps_versus_weight.png', dpi=100)
plt.figure()
# Start of fourth plot
plt.scatter(combined_data['monthly average steps'], combined_data['monthly weight gain'])
plt.setp(plt.gca().xaxis.get_majorticklabels(),rotation=90,)
plt.xlabel('Average Steps in 30 Day Period')
plt.ylabel('Weight Gain Compared to Previous 30 Day Period')
fig = matplotlib.pyplot.gcf()
fig.set_size_inches(12, 8)
fig.savefig('monthly_average_steps_versus_weight_gain.png', dpi=100)
plt.figure()
# Start of fifth plot
plt.scatter(combined_data['monthly average steps'], combined_data['monthly average weight'])
plt.setp(plt.gca().xaxis.get_majorticklabels(),rotation=90,)
plt.xlabel('Average Steps in 30 Day Period')
plt.ylabel('Monthly Average Weight')
fig = matplotlib.pyplot.gcf()
fig.set_size_inches(12, 8)
fig.savefig('monthly_average_steps_versus_monthly_average_weight.png', dpi=100)
plt.figure()
# Start of sixth plot
plt.plot_date(combined_data['date'], combined_data['steps'])
plt.setp(plt.gca().xaxis.get_majorticklabels(),rotation=90,)
plt.ylabel('daily steps')
fig = matplotlib.pyplot.gcf()
fig.set_size_inches(12, 8)
fig.savefig('steps.png', dpi=100)
plt.figure()
# Start of seventh plot
plt.plot_date(combined_data['date'], combined_data['weight'])
plt.setp(plt.gca().xaxis.get_majorticklabels(),rotation=90,)
plt.ylabel('daily weight')
fig = matplotlib.pyplot.gcf()
fig.set_size_inches(12, 8)
fig.savefig('weight.png', dpi=100)
plt.figure()
# Start of eight plot
plt.scatter(combined_data['steps'], combined_data['weight'])
plt.setp(plt.gca().xaxis.get_majorticklabels(),rotation=90,)
plt.xlabel('Steps')
plt.ylabel('Weight')
fig = matplotlib.pyplot.gcf()
fig.set_size_inches(12, 8)
fig.savefig('steps_versus_weight.png', dpi=100)
plt.figure()